PROFITABILITY ROLLING FORECAST
Identify opportunities and evaluate the impacts of changes in internal or external variables that affect the business.
“…71% of top performing organizations mitigate risks arising from volatile conditions by continually updating their forecasts to better reflect current business conditions…”
-Aberdeen Group
The War in Ukraine, Covid-19 or any other event that affects business are wake-up calls for organizations to have robust planning models. Experts in advanced analytics who are part of the planning or profitability team need to take a more relevant role in decision-making, for which a maturation of the qualitative and quantitative structures of their models applied to cost and profitability management is required. The “Institute of Management Accountants” (IMA) as well as the “Profitability Analytics Center of Excellence” (PACE) set out a reference framework, as well as stages of maturation for descriptive and predictive analytics from the perspective of management accounting, identifying its characteristics and evolution to come to operate an integrated model of Profitability Rolling Forecast.
It is no longer enough to have a historical cost and profitability model. In order to achieve a robust planning model, it is important to incorporate the projection scenario, updating it continuously. When closing a monthly period, the cost and profitability model will not only have the corresponding historical period, rather, at each closing, 12 to 18 months of projection will be processed and updated, every month. This process will result in the Profitability Rolling Forecast model.
With the Profitability Rolling Forecast model, we seek to comply with the following premise:
“The more cost information that helps the business understand how demand is related to supply and how cost behaves through cause and effect relationships, the better visibility, analysis, planning, budgeting, and business decision-making.”
Profitability rolling forecast: search for the cycle
Profitability rolling forecast benefits
Components of the Profitability Rolling Forecast model
The model contains three components: 1) History, 2) Projection and 3) Planning and/or Budget.
Each ingredient allows businesses to answer different key questions (and ask new ones):
- How much did it cost me…?
- What was the performance of…?
- How do I prioritize improvements?
- What is the variation of “actual” with respect to “projection”?
- What is the level of used and unused capacity?
- Or, what is the cost… of following the trend, business cycle, seasonality, etc.?
- What is the impact of changes such as unit cost, efficiency, increase in capacity, decrease in unscheduled stops?
- What is the behavior of the capacity? Are adjustments required?
- What is the “baseline” for budget generation and rate definition?
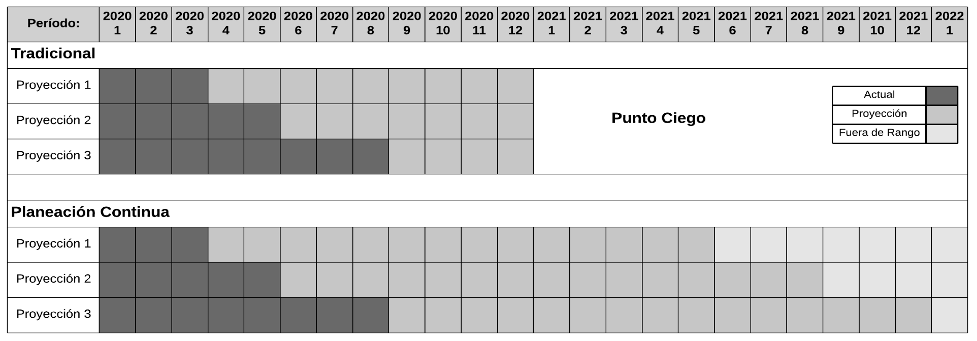
The following diagram compares the traditional approach and the Profitability Rolling Forecast approach: